
কিভাবে IELTS Writing Line Graph লিখতে হয়
IELTS Writing Task-1 Line Graph কিভাবে লিখতে হয়? এর জন্য দরকারি Vocabulary (বাংলা অর্থ সহ) এবং একটি Sample Question & Answer
IELTS Writing Task-1-এর মধ্যে একটি জনপ্রিয় প্রশ্ন হলো Line Graph বিশ্লেষণ করা। এই প্রশ্নে পরীক্ষার্থীদের একটি নির্দিষ্ট সময়ের মধ্যে বিভিন্ন ডেটা প্রদর্শন করা হয়, এবং সেই তথ্য বিশ্লেষণ করে ১৫০ শব্দের মধ্যে একটি রচনা লিখতে হয়। TalentHut IELTS পরীক্ষার্থীদের এই ধরনের প্রশ্নের সমাধান করার জন্য প্রয়োজনীয় নির্দেশিকা এবং টিপস প্রদান করে।
Task-1 Line Graph কীভাবে লিখতে হয়?
Line Graph লিখতে গেলে মূলত তিনটি অংশে ভাগ করে রচনা তৈরি করতে হয়:
1. Introduction (ভূমিকা)
এই অংশে আপনাকে গ্রাফটি কী ধরনের তথ্য উপস্থাপন করছে তা সংক্ষেপে বলতে হবে। মূলত, Line Graph-এর মূল বিষয়বস্তু কী, সেটি এক বা দুই লাইনে ব্যাখ্যা করা হয়।
Example:
“The line graph illustrates the number of tourists visiting three different countries over a period of ten years.”
2. Overview (সারাংশ)
এটি Writing Task-1-এর গুরুত্বপূর্ণ অংশ। এখানে আপনাকে গ্রাফের প্রধান বৈশিষ্ট্যগুলি বা কোন সাধারণ প্রবণতা (trend) দেখা যাচ্ছে, তা উল্লেখ করতে হবে।
Example:
“Overall, the number of tourists visiting all three countries increased over the period, with Country A experiencing the most significant rise.”
3. Details (বিস্তারিত বর্ণনা)
এখানে গ্রাফের ডেটাগুলির বিশদ বিবরণ দিতে হবে। ডেটাগুলোর উল্লেখযোগ্য পরিবর্তন বা গুরুত্বপূর্ণ তুলনামূলক তথ্য উপস্থাপন করতে হবে।
Example:
“In 2010, around 1 million tourists visited Country A, and this figure rose sharply to 5 million in 2020. Meanwhile, Country B started with 2 million tourists in 2010, which gradually increased to 3.5 million in 2020.”
Vocabularies that showed trends:
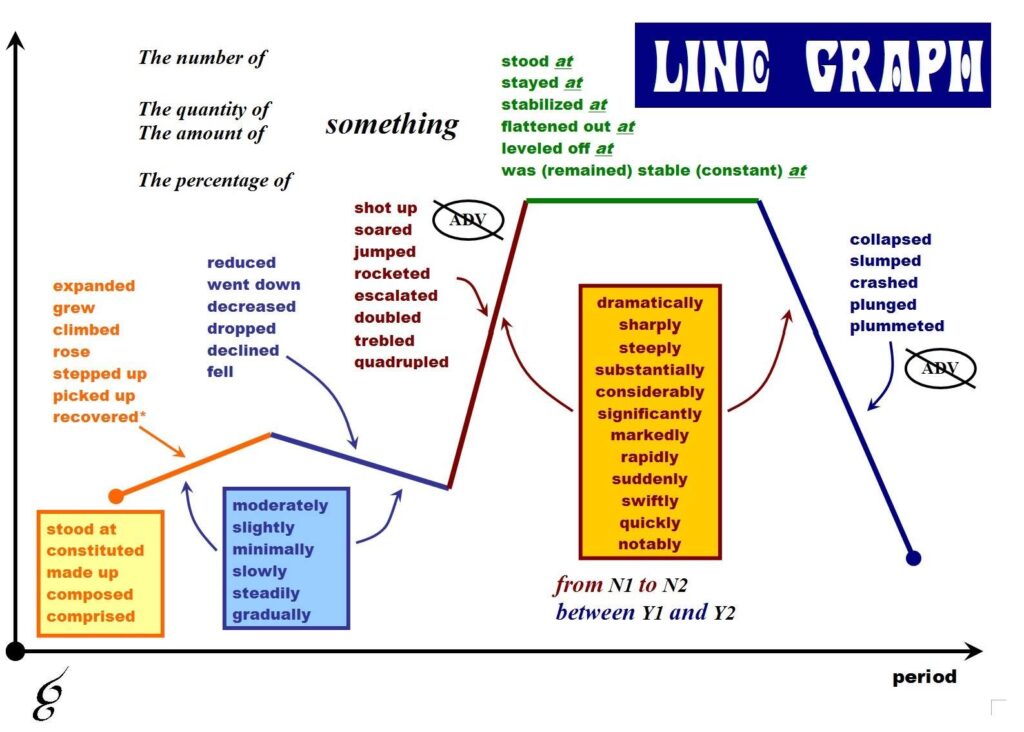
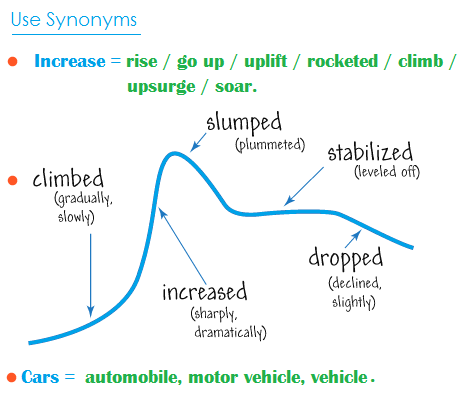
Synonyms that show the trends:
দরকারি Vocabulary (বাংলা অর্থ সহ)
IELTS Writing Task-1 Line Graph বর্ণনা করার জন্য কিছু নির্দিষ্ট শব্দভাণ্ডার ব্যবহার করতে হয়, যা গ্রাফের প্রবণতাগুলিকে প্রকাশ করতে সাহায্য করে। নিচে কিছু দরকারি Vocabulary এবং তাদের বাংলা অর্থ দেওয়া হলো:
1. Increase (বৃদ্ধি হওয়া)
Example: “The number of visitors increased significantly.”
(পর্যটকদের সংখ্যা উল্লেখযোগ্যভাবে বৃদ্ধি পেয়েছে।)
2. Decrease (হ্রাস পাওয়া)
Example: “The population decreased slightly over the period.”
(সময়কালের মধ্যে জনসংখ্যা সামান্য হ্রাস পেয়েছে।)
3. Fluctuate (উত্থান-পতন হওয়া)
Example: “The sales figures fluctuated throughout the decade.”
(দশক জুড়ে বিক্রির সংখ্যা উত্থান-পতনের মধ্যে ছিল।)
4. Peak (চূড়ায় পৌঁছানো)
Example: “The price of oil peaked in 2015.”
(২০১৫ সালে তেলের দাম চূড়ায় পৌঁছেছিল।)
5. Drop (পতন হওয়া)
Example: “There was a sharp drop in the number of students.”
(শিক্ষার্থীর সংখ্যা তীব্রভাবে পতিত হয়েছে।)
6. Rise (উচ্চ হওয়া)
Example: “The unemployment rate rose steadily.”
(বেকারত্বের হার ধীরে ধীরে বৃদ্ধি পেয়েছে।)
7. Steady (স্থিতিশীল)
Example: “The production rate remained steady throughout the period.”
(উৎপাদনের হার সময়ের মধ্যে স্থিতিশীল ছিল।)
8. Dramatic (নাটকীয়ভাবে)
Example: “The graph shows a dramatic increase in sales.”
(গ্রাফটি বিক্রিতে নাটকীয় বৃদ্ধি প্রদর্শন করে।)
9. Slight (সামান্য)
Example: “There was a slight decrease in the number of participants.”
(অংশগ্রহণকারীর সংখ্যায় সামান্য হ্রাস ঘটেছে।)
10. Rapid (দ্রুত)
Example: “The figures rose rapidly in the first quarter.”
(প্রথম ত্রৈমাসিকে সংখ্যাগুলি দ্রুত বেড়েছে।)
Sample Question & Answer
Sample Question:
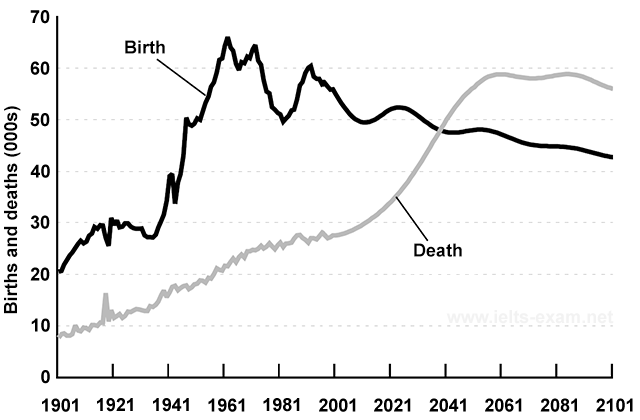
The graph below gives information about changes in the birth and death rates in New Zealand between 1901 and 2101.
Summarise the information by selecting and reporting the main features, and make comparisons where relevant.
Sample Answer:
The graph shows changes in the birth and death rates in New Zealand since 1901, and forecasts trends tip until 2101.
Between 1901 and the present day, the birth rate has been consistently higher than the death rate. It stood at 20,000 at the start of this period and increased to a peak of 66,000 in 1961. Since then the rate has fluctuated between 65 and 50 thousand and it is expected to decline slowly to around 45,000 births by the end of the century.
In contrast, the death rate started below 10,000 and has increased steadily until the present time. This increase is expected to be more rapid between 2021 and 2051 when the rate will probably level off at around 60,000, before dropping slightly in 2101.
Overall, these opposing trends mean that the death rate will probably overtake the birth rate in around 2041 and the large gap between the two levels will be reversed in the later part of this century.
(164 words)
TalentHut এর পরামর্শ:
TalentHut-এর বিশেষজ্ঞরা মনে করেন, Line Graph প্রশ্নের উত্তর লিখতে গেলে সঠিক শব্দভাণ্ডার এবং বিশ্লেষণাত্মক ক্ষমতা থাকা প্রয়োজন। এই দক্ষতা গুলো অর্জন করার জন্য সঠিক প্রস্তুতি ও অনুশীলন খুবই গুরুত্বপূর্ণ। TalentHut IELTS প্রার্থীদের জন্য বিভিন্ন ধরনের কোর্সের মাধ্যমে এই দক্ষতা উন্নত করতে সাহায্য করে।
উপসংহার:
IELTS Writing Task-1 Line Graph প্রশ্নে সফল হতে হলে ভালো শব্দভাণ্ডার, সময় ব্যবস্থাপনা এবং গ্রাফের তথ্য বিশ্লেষণ করার দক্ষতা অর্জন করতে হবে। TalentHut এর সাহায্যে নিয়মিত অনুশীলনের মাধ্যমে আপনি সহজেই Writing Task-1-এর চ্যালেঞ্জ মোকাবিলা করতে পারবেন।
আমাদের সাথে যোগাযোগ করতেঃ
Email: [email protected]
Hotline: +8801611237732 (WhatsApp)
Dhaka office: +8801611237734 (WhatsApp)
Gazipur Office: +8801770708056 (WhatsApp)